


Guide to Parabolic SAR Indicator
SAR follows price and can be considered a trend-following indicator. Once a downtrend reverses and starts up, SAR follows prices like a trailing stop.
Introduction
Indicators and patterns abound in technical analysis, allowing traders to anticipate future asset price movement. Traders and analysts can use a plethora of indicators, which rely on numerous algorithms and historical data, to predict the likely course of price action. The parabolic SAR indicator is based on the premise that market patterns tend to repeat themselves.
Let's talk about the Parabolic SAR indicator, what it is, how it works, and the pros and cons of employing it.
What Is Parabolic SAR?
Trading direction can be determined with the aid of the Parabolic SAR, which is a trend-following and stop-and-reversal pattern. This indicator's principal use is to help spot turning points in an underlying security's trend, as well as optimal entry and exit positions.
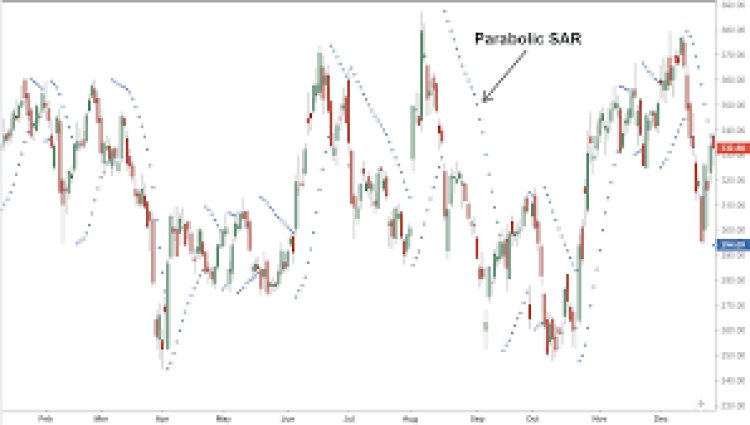
Welles Wilder created this indicator in the 1970s, and it performs exceptionally well in uptrending markets. Parabolic SAR data is displayed as a scatter plot. The dots are seen as a bullish signal for the underlying securities when they are plotted below the bars, and as a bearish signal when they are plotted above the bars.
Many traders utilise this indicator to set appropriate levels for their trailing stop-losses because, unlike MACD, it is a lagging indicator.

How Does It Work?
Parabolic SAR indicator positioning on the graph is based on two variables. Both the Extreme Price and the Acceleration Factor are important considerations. To put it another way, the EP is the highest high reached by the security during the uptrend. The Acceleration Factor, on the other hand, has a fixed value of 0.02 and can go up to 0.20. When a new EP is released, the acceleration factor is increased by 0.02.
How To Trade Parabolic SAR?
Parabolic SAR is a straightforward trading tool. When the indicator's dots are displayed below the candlestick bar, it's a bullish sign that the price of the securities will rise. When the dots are above the bars, it's a good opportunity to sell because it indicates a downward trend in the security.
What Are The Pros And Cons Of Parabolic SAR?
The Parabolic SAR indicator's most appealing feature is the clarity it brings to trending markets by indicating the direction of the trend. It aids traders in determining when to enter and quit a market based on price action.
However, when markets are relatively flat, this indication might be misleading. The indicator is useless at these moments, leading to poor trading possibilities.
Learning how to use the Parabolic SAR indicator is crucial for making profitable directional trades. Sign up for an account now to use these signals and patterns to your advantage and make better trading decisions.
Also Read : Recent inflation surprise pushes out expectation for rate cut into FY25: Indranil Pan


.jpeg?updatedAt=1701531784082)