Difference Between Shooting Star And Inverted Hammer Candlestick Patterns
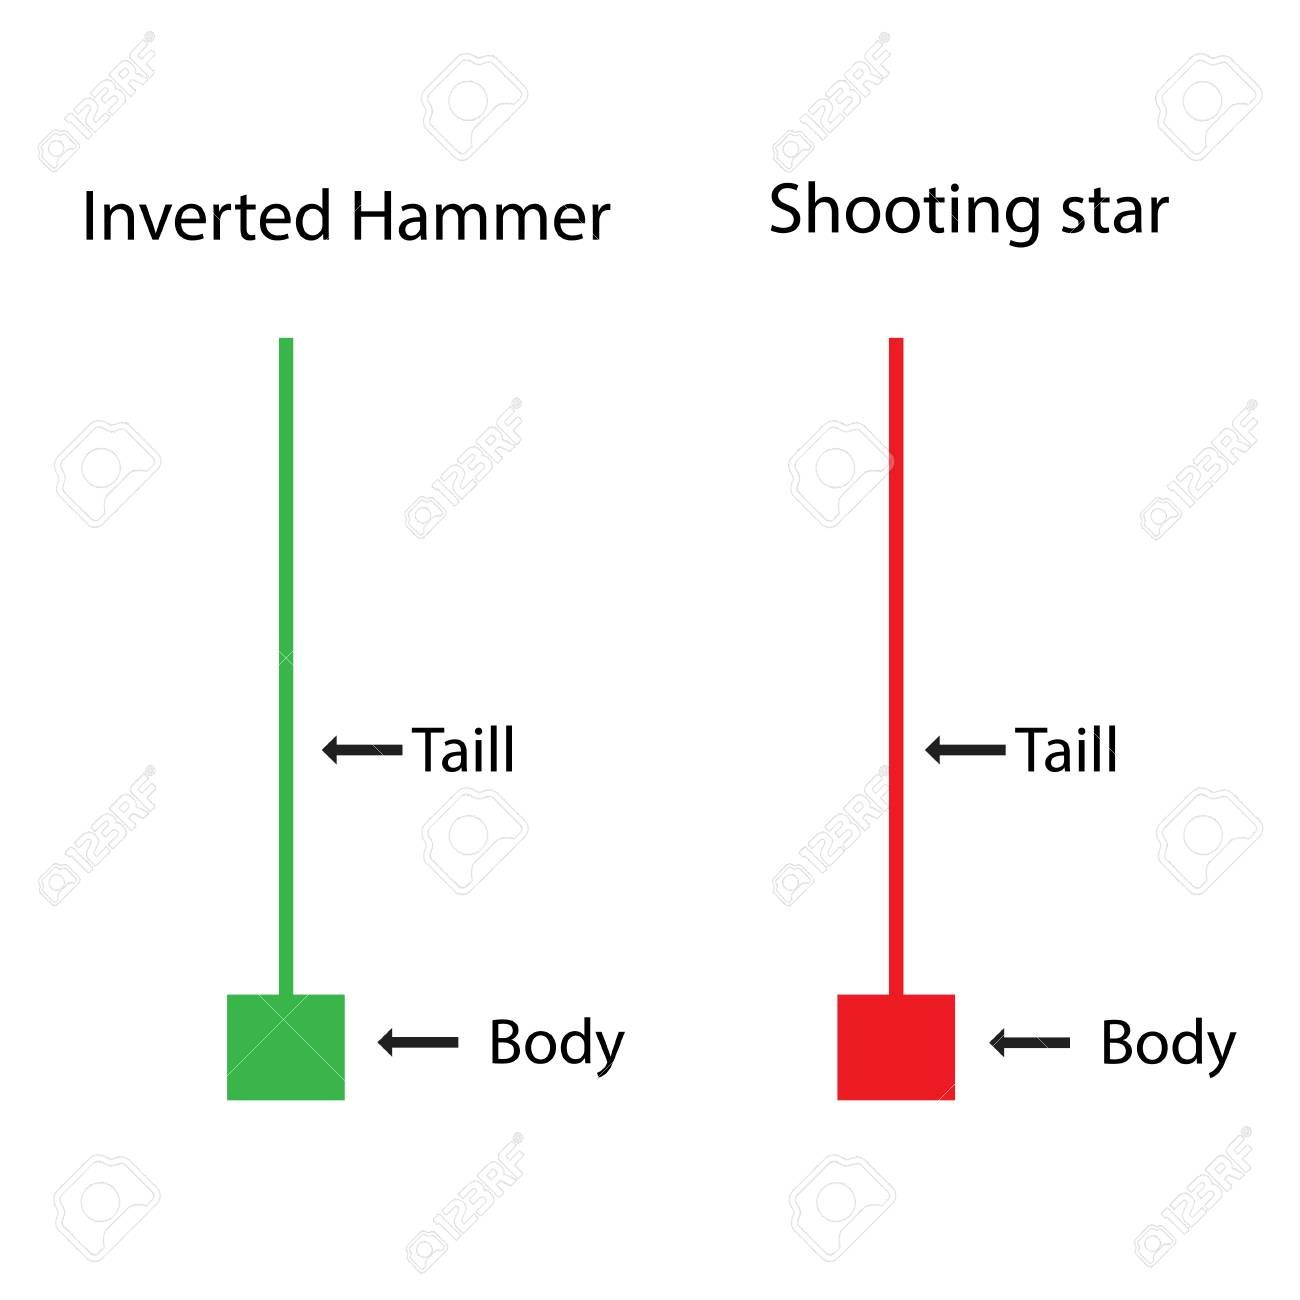
Technically, the only distinction between this and a shooting star candle is that it resembles an inverted hammer during a downtrend.

Introduction:
Candlestick patterns are a prominent strategy used by stock market traders to forecast short-term price fluctuations and make sound trading decisions. They are made up of one or more candles that have separate wicks, bodies, and shadows. Understanding different candlestick patterns enables you to identify potential trend reversals or continuations, as well as decide entry and exit locations for your trades.
This post will teach you about two important candlestick patterns: the shooting star and the inverted hammer. Both of these patterns signal trend reversals, but under different conditions. Here's more information on their meaning, relevance, and distinctions.
What is a shooting star candlestick pattern?
The shooting star pattern is a bearish reversal pattern that appears at the end of an uptrend. It has a single candlestick with a small body, an insignificant bottom shadow, and a large top shadow that is at least twice the length of the body. The extended upper shadow implies that the stock price has risen significantly during the current trading session. However, by the closing point, the sellers had regained control, resulting in a price decrease.
Key characteristics of the shooting star pattern
The following are the important characteristics for recognizing the shooting star pattern:
- Small body, showing that the opening and closing prices are near to each other
- Long upper shadow, indicating that purchasers failed to maintain bullish momentum
- Lower shadow is very brief or non-existent.
Interpretation of a shooting star pattern
The development of a shooting star pattern indicates that bullish momentum is fading and that a possible reversal to the downside is coming. As a result, it may be a good time to enter a new short position or exit a long position. However, before making trading decisions, you should seek for confirmation signals such as a negative follow-through in the next candle or a shift in other technical indicators.
What is an inverted hammer candlestick pattern?
An inverted hammer, on the other hand, is a bullish reversal pattern that often happens at the end of a downtrend. It has a little true body, an insignificant above shadow, and a long lower shadow that is at least twice the length of the body, similar to the shooting star pattern. The extended lower shadow shows that the stock price was dramatically driven lower during the trading session by sellers. However, by the closing point, the purchasers had retaken control, resulting in a price increase.
Key characteristics of an inverted hammer
The important elements for identifying the inverted hammer pattern are as follows:
- Small body, showing that the opening and closing prices are near to each other
- Long lower shadow, indicating that sellers failed to maintain bearish momentum
- Upper shadow is very brief or non-existent.
Interpretation of the inverted hammer pattern
The formation of the inverted hammer pattern indicates that bearish momentum is diminishing and that a trend reversal to the upside is possible. As a result, it may be a good time to enter a new long position or exit a short position. However, much like with the shooting star pattern, you should double-check your trading decisions with other technical indicators and candlestick patterns.
Major differences between shooting star and inverted hammer
You should now understand the shooting star and inverted hammer designs. While both of these patterns have little real bodies and long shadows, the difference is in the position of the bodies and the shadows. While the little body of a shooting star pattern is at the bottom of the price chart with a long higher shadow, the small body of an inverted hammer pattern is at the top with a long lower shadow.
Furthermore, the shooting star is a bearish reversal pattern that occurs at the end of an uptrend, marking an ideal time to begin a fresh short position. The inverted hammer pattern, on the other hand, is a bullish reversal pattern that occurs at the end of a downtrend, marking an appropriate time to initiate a new long position.
Also read :- Charlie Munger - From Broke to a Billionaire
To conclude
Understanding candlestick patterns such as shooting stars and inverted hammers is critical for making informed stock market trading decisions. However, the two designs appear to be very similar. As a result, you must recognize the differences between them in order to prevent making incorrect conclusions and incurring large losses. Furthermore, you should constantly double-check your trading selections using different candlestick patterns and technical indicators.


